
Trim Tabs Market Grow Pricing, Features, Reviews & Comparison of Alternatives
Other |
2026-03-05 10:03:11
 Russian
 English
 Romaian
 Portuguese (Brazil)
 Greek
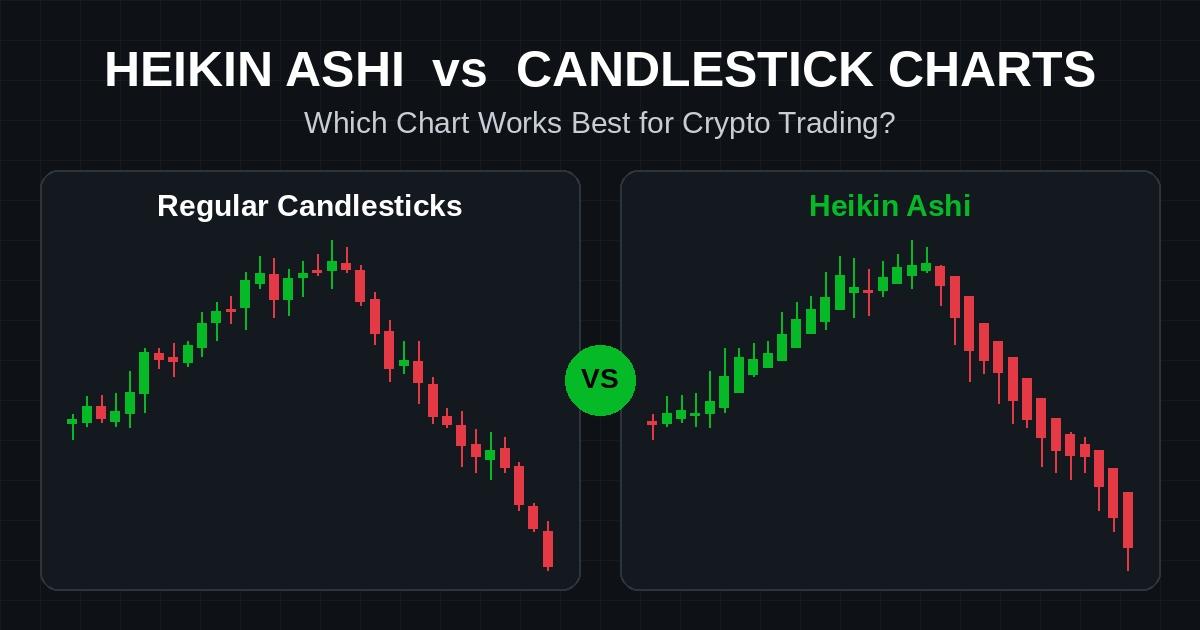
Crypto markets never sleep. Bitcoin can rise 5% in an hour and then give it all back before lunch. Because of this, the chart you read shapes almost every decision you make. A noisy chart can shake you out of a good trade. On the other hand, a chart that smooths too much can make you late to the move.
That is exactly why the heikin ashi vs candlestick charts debate never seems to end. Both charts use the same market data. Yet they tell the price story in very different ways. In this guide, you will learn how each chart works, where each one shines, and how experienced traders often combine them.
Japanese candlesticks date back to rice traders in 18th-century Japan. Today, they are the default chart on almost every crypto exchange and charting platform.
Each candle shows four prices for a chosen period: the open, high, low, and close. The body shows the range between the open and the close. Meanwhile, the thin lines above and below, called wicks or shadows, mark the highest and lowest prices reached.
A green candle means the price closed higher than it opened. A red candle means it closed lower. It sounds simple, but the real value lies in the detail. Every candle reflects prices that actually traded. So when Ethereum spikes down to a support zone and snaps back, you see that move exactly as it happened.
First and foremost, regular candles are precise. They show true price levels, which matters when you place stop-loss orders or limit entries. In addition, they power classic price action patterns such as engulfing bars, pin bars, dojis, and inside bars. Support and resistance levels are also drawn from real highs and lows, so your key zones stay accurate.
The main drawback is noise. Crypto is volatile, and lower timeframes are full of fake moves. For example, a healthy uptrend on a 15-minute chart can still print three or four red candles in a row. As a result, many traders panic and exit too early. Over time, this noise often leads to overtrading and emotional decisions.
Heikin Ashi means "average bar" in Japanese. Instead of plotting raw prices, it builds each candle from averages. The goal is to filter out noise so the trend becomes easier to see.
Here is how each Heikin Ashi candle is calculated:
Because each new candle depends on the one before it, the chart moves in smoother waves. Uptrends tend to show long runs of green candles. Likewise, downtrends show long runs of red ones. Short counter-moves that would print a red candle on a normal chart often stay green on Heikin Ashi.
Once you know what to look for, Heikin Ashi is easy to read. Watch for these signals:
On the surface, both charts look alike. However, the heikin ashi vs regular candles comparison reveals four differences that matter in real trading.
Heikin Ashi prices are calculated, not traded. In other words, the HA close on your screen is usually not a price you could have bought or sold at. This matters more than most beginners realize. If you set a stop below a Heikin Ashi low, it may sit at a level the market never touched. Regular candles, by contrast, always show the real price.
This is where Heikin Ashi wins. Averaging removes many small swings, so trends appear cleaner. Therefore, it becomes easier to stay in a winning trade instead of jumping out at the first red candle. Regular candles show every flicker, which is useful for detail but tiring for trend-following.
Smoothing always comes at a cost, and that cost is lag. Since each HA candle uses past data, color changes often appear one or two candles after the real turn. In fast crypto markets, two candles on a 4-hour chart means eight hours. That delay can eat a large part of the move.
Classic candlestick patterns do not translate well to Heikin Ashi. An engulfing pattern or a pin bar on an HA chart does not carry the same meaning, because the candle shapes are averaged. If your strategy depends on price action patterns, regular candles are the better fit.
Crypto has a few traits that make the heikin ashi vs candlestick charts choice more important than in traditional markets.
To begin with, crypto trades 24/7. There are no opening gaps, so Heikin Ashi candles flow without the distortions that gaps cause on stock charts. That is a quiet advantage for HA users.
Next, crypto is famous for sharp liquidation wicks. A cascade of forced selling can push price down 4% in a minute before it recovers. On regular candles, that long wick is clearly visible. On Heikin Ashi, it gets partly averaged away. This cuts both ways. On one hand, HA keeps you calm during the spike. On the other hand, it hides useful information, such as where buyers stepped in.
Finally, many altcoins have thin order books. Their charts look messy on regular candles, with random wicks everywhere. In these markets, Heikin Ashi can make a chaotic chart readable. Still, you should always check real prices before placing orders on low-liquidity coins.
Over the years, the most reliable heikin ashi trading strategy I have seen is also the simplest. It uses Heikin Ashi to judge the trend and regular candles to execute. Here is how it works, step by step.
As always, risk management matters more than the entry. Many professional traders risk only 1% to 2% of their account per trade. That way, a few losing trades never turn into a disaster.
For example, imagine Solana trending up on the 4-hour chart above its 50 EMA. After a three-candle pullback, a large green HA candle prints with no lower wick. You switch to regular candles, spot the real swing low, and place your stop there. Then you let the trade run until the HA candles start to weaken.
Even a solid heikin ashi trading strategy can fail if you make these errors:
There is no single winner in the heikin ashi vs candlestick charts debate. Instead, the right chart depends on how you trade.
Scalpers and day traders usually do better with regular candles. They need precise levels and fast signals, and lag is costly on short timeframes.
Swing and position traders often benefit from Heikin Ashi. It helps them hold trades longer and ignore minor pullbacks that would otherwise trigger an early exit.
Price action traders should stick with regular candles. Their patterns, levels, and wick analysis all depend on real price data.
Beginners can find Heikin Ashi helpful for learning to read trends. Even so, it is wise to master regular candles first. Without that foundation, it is hard to understand what the averaged chart is hiding.
In practice, the heikin ashi vs candlestick charts question rarely ends with one choice. Many seasoned traders keep both charts open side by side. They read the trend on Heikin Ashi and make decisions on regular candles.
This hybrid approach gives you the best of both worlds. You get a calm, clear trend view that reduces emotional exits. At the same time, you keep the accuracy you need for entries, stops, and targets. Most charting platforms let you switch chart types in one click, so the setup takes only seconds.
Overall, both chart types have earned their place. Regular candles show the truth of every trade, while Heikin Ashi shows the direction of the crowd. In the end, the heikin ashi vs regular candles choice comes down to your timeframe, your style, and how well you handle noise. Whichever chart you use, test your approach on historical data and in a demo account before risking real funds. The same rule applies to any indicator or signal tool you add to your charts, including GainzAlgo. Many traders search "is GainzAlgo legit" before trying it, and that kind of research is a healthy habit. Look at how a tool generates its signals, read independent reviews, and back-test it yourself, because no chart or indicator can replace sound risk management.